Posts

Showing posts from May, 2016

"The Trend is Your Friend" Trading System

Image
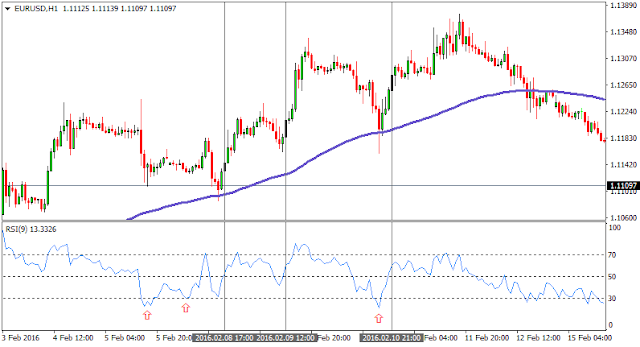
I always hear people talking about the trend being your friend so I thought I’d come up with a system that does just that.  (Disclaimer: This is coming from a total newbie.) From everything that I have read, I thought I would combine a couple of trend-following indicators.  I picked EMA (100) and RSI (9) and applied them to the 1-hour timeframe.  I've read in some forums that a lot of traders pay attention to moving averages especially on the daily timeframe. But because making a system based on the daily timeframe generates only very few signals, I thought I'd put it on the 1 hour instead.  I also saw that price reacted well to the MA, finding support/resistance from time to time. As for the RSI, I intend to use it as a "filter" to confirm if the trend is strong or not. Here's my idea for an entry: Sell if price is below the 100 EMA, RSI is coming from 70 or 70+ and now below 50.  Buy if price is above 100 EMA, and RSI is coming from 30

Amazing Crossover System - 100+ pips per day!

Image
Greetings everyone, **I got the main concept for this system on another site. While I have made one important change, I must stress that the heart of this system was created by someone else! We must give credit where credit is due!** This system is incredibly simple yet unbelievably effective. If you properly follow the system, I strongly believe that you can easily gain 100+ pips per day with very few losing trades! SYSTEM: Indicators ---------- 5 EMA -- YELLOW 10 EMA -- RED RSI (10 - Apply to Median Price: HL/2) -- One level at 50. TIME FRAME ------------- 1 Hour Only (very important!) VIEW ----- Zoom in quite a bit on your chart so that the candlesticks and EMA's are very large. I use Alpari and this translates into the penultimate (one just previous of the highest) magnification. PAIRS ------ Virtually any pair seems to work as this is strictly technical analysis. I recommend sticki

"The Ribbon" Trading System

Image
       Download the book here:       Ribbon trading manual - Version 1.0 - PDF   Hello I hope all is well for you and yours. I was introduced to this system for free by a mysterious professional who called himself Raj. Someone showed him the system and he like i am paying it forward so to speak. This system is very simple yet very powerful when used correctly. I am not going to go into great detail here on the post. I will provide the free pdf manual that i was given to you for free. I'll post a brief description and a couple examples. Enjoy and pay it forward! This system consists of two simple moving averages set to 6-0 and 6-1. When these averages cross over the create what's called the ribbon. See the attachment: Do yourself a favor and at least demo trade this system after reading the manual I think you will be pleasantly surprised! Enjoy Read more: http://forums.babypips.com/free-forex

The 3 Duck's Trading System

The system is fairly straight forward and easy to use. Like a lot of trading systems it will be more productive when prices are moving in one direction and not stuck in a tight trading range. Of course this system has losing trade and losing runs, but with proper money management and good discipline I'm sure this system will keep you out of bad trades and give you a great chance to make profits in the Fx market. One of the nice things about this system is it will quickly tell you if prices are in an up or down swing phase and stop you from guessing! It will also allow you to decide to be a bull or a bear and trade in the direction of that trend. There are 3 charts involved in this system: a 4hr chart, a 1hr chart and a 5min chart. There is 1 indicator, a 60 period simple moving average (60 sma) plotted on each chart. There you go, its that simple. How it works: Step 1 - First Duck   The first thing we need to do is look at our largest time-frame (4hr chart) a

'London Breakout' Trading System

  This London Breakout strategy has a win ratio of over 90% .   Currency pair: GBP/USD, EUR/USD - tested. Other pairs may also be used.   Time frame: 1 hour   Indicators: none   At this point it might be an idea to bring up the chart at the bottom of this post and read the strategy whilst looking at the chart.   Trading setup:   For this Forex system to work properly a trader needs to know the basics of drawing trend lines and be able to identify support and resistance lines.   Our working range includes 5 candles: from midnight to 04:00 EST (including the 04:00 candle).   Optional: draw a midnight vertical line for visual aid.   With those 5 candles look for valid swing high and swing low of the price. Draw a downtrend trend line connecting a found swing high to the most recent swing high of the previous days (make sure the last one is a valid high to draw a downtrend trend line through it).   Do the same for a swing low: connect it to the most

The Cowabunga System

Image
Here I will take a simple system and apply it everyday to the Forex market. By following along, I hope that you’ll be able to use this as a guide for following your own trading system each and every day. But before you follow along, here is a little background on the system that I will be trading. About The System The system is mostly based on the example given in the Mechanical Trading System lesson in our School of Pipsology, but I’ve added a few tweaks that I think will help filter out those whipsaws and increase our win percentage. While the title of the system in the lesson is called the "So Easy It’s Ridiculous" system, actually applying it is not. The point I try to stress is that a trading system can be simple and profitable at the same time. This blog will attempt to guide you on the application part of it The Main Trend Is Your Friend The main concept of the theory is to catch small trends during the day while avoiding fak

The HLHB System

Image
Good day, forex friends! I had a relatively light shift at the coffee shop today so I was feeling energized and ready to work on my trading skills. As I was doing my research, I got so intrigued with Pip Surfer’s blog because it made me realize that it was possible to trade, and even profit from, a purely mechanical system . I’ve read that the biggest issue that prevents traders from winning is the psychological burden of entering a trade, holding on to a trade, and eventually exiting a trade. By having a mechanical system with a strict set of rules, this psychological burden is lifted from the trader and makes jumping in and out of a trade easier. Philosophy I keep hearing that “the trend is your friend” so I decided to come up with a system that would allow me jump in a trade based on the general direction of the price movement. I’ll be combining a trend-following indicator ( moving averages ) with an oscillator ( stochastic ) for confirmation. On top of that, I’ll b

The “So Easy It’s Ridiculous” Trading System

Image
  Trading Setup Trade on daily chart ( swing trading ) 5 SMA applied to the close 10 SMA applied to the close Stochastic (14,3,3) RSI (9) Trading Rules Entry Rules Enter long if: The 5 SMA crosses above the 10 SMA and both Stochastic lines are heading up (do not enter if the Stochastic lines are already in the overbought territory) RSI is greater than 50 Enter short if: The 5 SMA crosses below the 10 SMA and both Stochastic lines are heading down AND (do not enter if the Stochastic lines are already in oversold territory) RSI is less than 50 Exit Rules Exit when the 5 SMA crosses the 10 SMA in the opposite direction of your trade OR if RSI crosses back to 50 Exit when trade hits stop loss of 100 pips Okay, let’s take a look at some charts and see this baby in action…  Here’s an example of a long trade setup: If we went back in time and looked at this chart, we would see that according to our system rules, this would be a good