Posts

Featured post

3 Little Pigs Trading System

Image
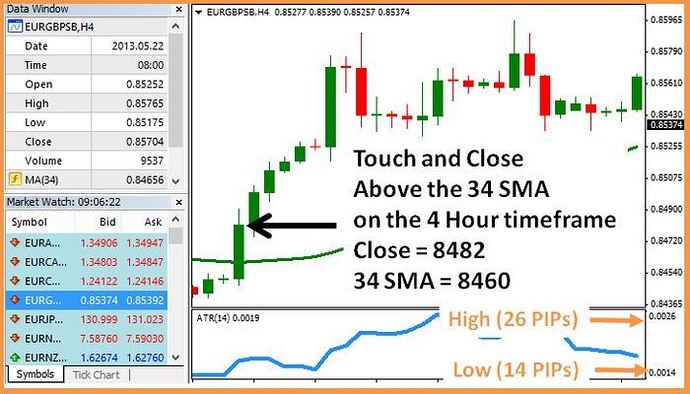
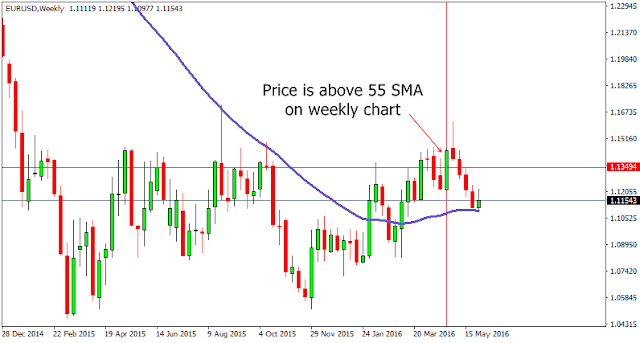
OVERVIEW The 3 Little Pigs is based on 3 timeframes, Weekly, Daily and 4 Hour. The idea is to “swing” trade in the direction of all 3 timeframes, a Buy signal, as an example: • Price is above the 55 Simple Moving Average (SMA) on the Weekly timeframe • Price is above the 21 SMA on the Daily timeframe • Price closes above the 34 SMA on the 4 Hour timeframe When the above conditions are met a Long position is opened. These are the basics - Sell is vice versa. ENTRY As I mentioned, there are a number of options in the manual – Here is my chosen approach: BUY • Price is above the 55 SMA on the Weekly timeframe and • Price is above the 21 SMA on the Daily timeframe, I will enter • On close of the next candle that touches and then closes above the 34 SMA on the 4 Hour timeframe SELL • Price is below the 55 SMA on the Weekly timeframe and • Price is below the 21 SMA on the Daily timeframe, I will enter • On close of the next candle that touches and then closes below the 34 SM

“Moving Average MACD Combo” Trading System

Image
Trading setup Trade on 30 minutes chart 100 SMA applied to the close on 30 min chart 50 SMA applied to the close on 30 min chart MACD (12,26,9) applied to the close on 30 min chart Trading Rules Entry Rules   Long entry rules: If the price is above the 50 and 100 SMA on 30-min chart. Then it’s a buy signal. We enter when MACD histogram crosses zero line and become positive. If MACD histograms already in the positive territory and making “lower highs”, then we’ll wait for the histograms to make “higher highs” to enter the market.   Short entry rules: If the price is below the 50 and 100 SMA on 30-min chart. Then it’s a sell signal. We enter when MACD histogram crosses zero line and become negative. If MACD histograms already in the negative territory and making “higher lows”, then we’ll wait for the histograms to make “lower lows” to enter the market.  Exit Rule We exit when MACD hist

ADX Trading System

Image
Trading setup Trade on 15 minutes chart (can be traded on any chart except 1-min) 9 EMA applied to the close ADX (14) applied to the close and set a level of 20 . Color: ADX line: Red, +DI line: Blue, -DI line: Dark violet   Trading Rules Entry Rules Long entry rules:  Price is coming up from below 9 EMA. Candle closes above 9 EMA ADX +DI value is greater than 20 ADX -DI value is lesser than +DI   Short entry rules: Price is coming down from above 9 EMA. Candle closes below 9 EMA ADX -DI value is greater than 20 ADX +DI value is lesser than -DI Exit Rule Long Exit rules:  ADX line heading down or Candle closed below 9 EMA or   ADX +DI value is lesser than -DI Short Exit rules:  ADX line heading down or Candle closed above 9 EMA ADX -DI value is lesser than +DI     Stop Loss 20 pips Take Profit 20 pips or We can take profit when we exit according to

“10 PiPs” Trading System

Image
This system is adapted from  the ribbon trading system . If you wanna know the ribbon thing, then you must read this ebook... You can download the book here... Ribbon trading manual - Version 1.0 - PDF                                                                                                                                                                           Trading setup Trade on 2 charts: 5 minutes and 30 minutes 34 SMA applied to the close on 5 min chart 6 SMA applied to the Typical Price (HLC/3), Shift= 0 on both charts 6 SMA applied to the Typical Price (HLC/3), Shift= 1 on both charts MACD (12,26,9) applied to the close on 5 min chart. Trading Rules Entry Rules Long entry rules:  If the price is above the 34 SMA and “The Ribbon” and MACD Histogram is positive on 5 min chart. Then it’s a buy signal. We enter if the price is above “The Ribbon” on 30 min chart. If the price is not yet above the

“The Holy Grail” Trading System

Image
Trading setup Trade on 4 charts: 1 hour, 4 hours, Daily, Weekly ( Swing Trading ) 55 SMA applied to the close on weekly chart 21 SMA applied to the close on daily chart 34 SMA applied to the close on 4 hours chart 34 SMA applied to the close on 1 hour chart Trading Rules Entry Rules Long entry rules: If price is above the 55 SMA on weekly chart, 21 SMA on daily chart and 34 SMA on 4 hours chart. Then it’s a buy signal. We enter when price crosses above 34 SMA on 1 hour chart. If price already crossed above 34 SMA on 1 hour chart before the buy signal, then we enter when we see the buy signal. Pretty simple, huh? Short entry rules: If price is below the 55 SMA on weekly chart, 21 SMA on daily chart and 34 SMA on 4 hours chart. Then it’s a sell signal We enter when price crosses below 34 SMA on 1 hour chart. If price already crossed below 34 SMA on 1 hour chart before the sell signal, then we enter when we see the sell signal.