“The Holy Grail” Trading System
Trading setup
- Trade on 4 charts: 1 hour, 4 hours, Daily, Weekly (Swing Trading)
- 55 SMA applied to the close on weekly chart
- 21 SMA applied to the close on daily chart
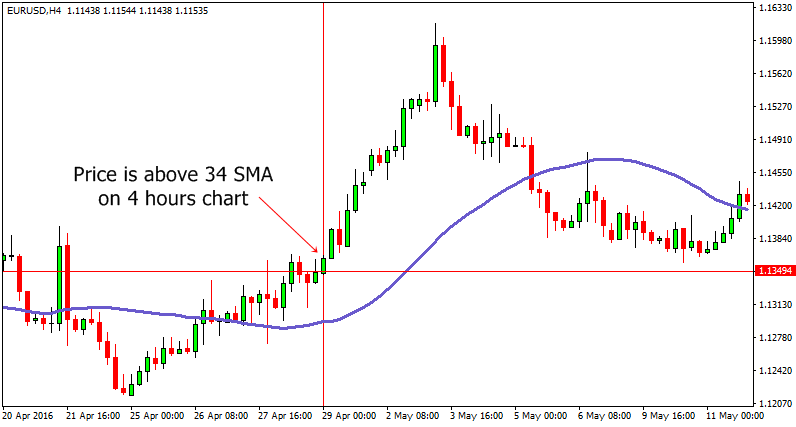
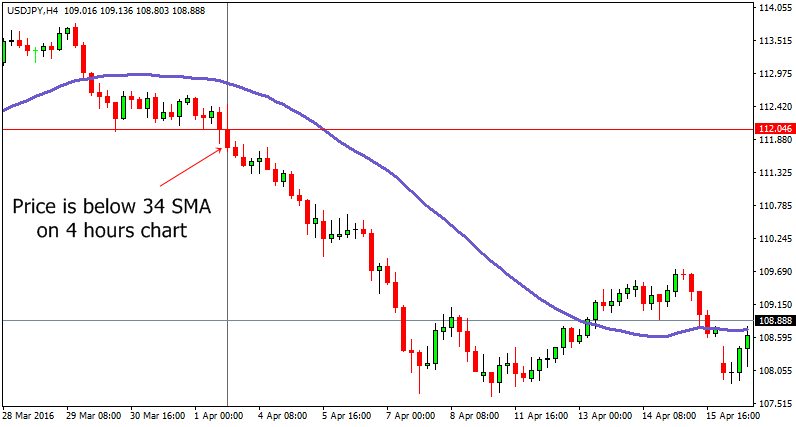
- 34 SMA applied to the close on 4 hours chart
- 34 SMA applied to the close on 1 hour chart
Trading Rules
Entry Rules
Long entry rules:
- If price is above the 55 SMA on weekly chart, 21 SMA on daily chart and 34 SMA on 4 hours chart. Then it’s a buy signal.
- We enter when price crosses above 34 SMA on 1 hour chart. If price already crossed above 34 SMA on 1 hour chart before the buy signal, then we enter when we see the buy signal. Pretty simple, huh?
Short entry rules:
- If price is below the 55 SMA on weekly chart, 21 SMA on daily chart and 34 SMA on 4 hours chart. Then it’s a sell signal
- We enter when price crosses below 34 SMA on 1 hour chart. If price already crossed below 34 SMA on 1 hour chart before the sell signal, then we enter when we see the sell signal.
Exit Rule
- We exit when price closes beyond 34 SMA on 1 hour chart in the opposite direction of our trade.
Stop Loss
- Set the stop beyond the 34 SMA on 1 hour chart.
Take Profit
- We take profit according to our exit signal.
Re-entry
- If we exit the trade according to our exit rule and price again crosses the 34 SMA on 1 hour chart while there’s still a buying or selling signal exist, then we can re-enter the market.
Long Trade Example:


Short Trade Example:


You must test this system thoroughly through back testing and by trading it live on a demo account for at least 2 months. After two months of testing if you find it profitable, only then use it on a real account.
Remember one thing, I’m not
responsible for your losses.