Posts

Showing posts from June, 2016

ADX Trading System

Image
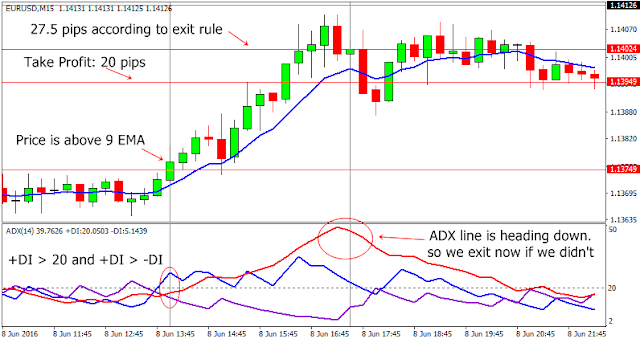
Trading setup Trade on 15 minutes chart (can be traded on any chart except 1-min) 9 EMA applied to the close ADX (14) applied to the close and set a level of 20 . Color: ADX line: Red, +DI line: Blue, -DI line: Dark violet   Trading Rules Entry Rules Long entry rules:  Price is coming up from below 9 EMA. Candle closes above 9 EMA ADX +DI value is greater than 20 ADX -DI value is lesser than +DI   Short entry rules: Price is coming down from above 9 EMA. Candle closes below 9 EMA ADX -DI value is greater than 20 ADX +DI value is lesser than -DI Exit Rule Long Exit rules:  ADX line heading down or Candle closed below 9 EMA or   ADX +DI value is lesser than -DI Short Exit rules:  ADX line heading down or Candle closed above 9 EMA ADX -DI value is lesser than +DI     Stop Loss 20 pips Take Profit 20 pips or We can take profit when we exit according to

“10 PiPs” Trading System

Image
This system is adapted from  the ribbon trading system . If you wanna know the ribbon thing, then you must read this ebook... You can download the book here... Ribbon trading manual - Version 1.0 - PDF                                                                                                                                                                           Trading setup Trade on 2 charts: 5 minutes and 30 minutes 34 SMA applied to the close on 5 min chart 6 SMA applied to the Typical Price (HLC/3), Shift= 0 on both charts 6 SMA applied to the Typical Price (HLC/3), Shift= 1 on both charts MACD (12,26,9) applied to the close on 5 min chart. Trading Rules Entry Rules Long entry rules:  If the price is above the 34 SMA and “The Ribbon” and MACD Histogram is positive on 5 min chart. Then it’s a buy signal. We enter if the price is above “The Ribbon” on 30 min chart. If the price is not yet above the

“The Holy Grail” Trading System

Image
Trading setup Trade on 4 charts: 1 hour, 4 hours, Daily, Weekly ( Swing Trading ) 55 SMA applied to the close on weekly chart 21 SMA applied to the close on daily chart 34 SMA applied to the close on 4 hours chart 34 SMA applied to the close on 1 hour chart Trading Rules Entry Rules Long entry rules: If price is above the 55 SMA on weekly chart, 21 SMA on daily chart and 34 SMA on 4 hours chart. Then it’s a buy signal. We enter when price crosses above 34 SMA on 1 hour chart. If price already crossed above 34 SMA on 1 hour chart before the buy signal, then we enter when we see the buy signal. Pretty simple, huh? Short entry rules: If price is below the 55 SMA on weekly chart, 21 SMA on daily chart and 34 SMA on 4 hours chart. Then it’s a sell signal We enter when price crosses below 34 SMA on 1 hour chart. If price already crossed below 34 SMA on 1 hour chart before the sell signal, then we enter when we see the sell signal.

5/13/62 Trading System

Image
Trading Setup Trade on any chart except 1 minute. I recommend 1- h our timeframe 5 EMA applied to the clos e   13 EMA applied to the close  62 EMA applied to the close  MACD (12,26,9) applied to the close Trading Rules  Entry Rules   Enter if there’s no big news coming within 2 hours.   Enter if you can afford to lose money.  Long entry rules: Go long when the three EMA’s compress together and begin to fan out. (5 period EMA fans out on top of the 13 period EMA, and the 13 period EMA on top of the 62 period EMA) And the MACD Histograms must turn into positive territory. Or making higher highs into positive territory. Don’t go long when MACD Histograms making lower highs. Wait for MACD to make higher highs or grow longer again into positive territory. Go long when price hit the 62 period EMA and bounce back up and MACD Histograms also making higher highs into positive territory. Here the 62